{kind=image/jpg}
We’ve all seen a movie become a major box-office hit without earning a single award. And we’ve seen others collect all the trophies but attract relatively small audiences. Success in one area doesn’t always mean success in another. Search performance is the same.
A business can rank first on Google and still go unmentioned when someone asks ChatGPT for a recommendation. It can also get named in AI answers while organic traffic stays flat. Rankings, AI mentions, and website visits each measure something different, with no single number telling you how you're doing. What you need is the full picture. Here's how to track SEO, AEO, and AI search performance together.
Which Traditional SEO Metrics Still Matter and Where Can You Find Them?
Good news on the SEO front (and all the work you’ve been doing to date): old-school metrics still matter. Consider these the four cornerstones: organic traffic, organic rankings, impressions, and clicks.
Organic traffic can be found in GA4 under Reports > Acquisition > Traffic acquisition, filtered to Organic Search. Compare year-over-year to separate real growth from seasonal swings.
Google Search Console (Performance > Search results) shows average organic rankings, impressions, clicks, and click-through rate (CTR) by query or page. Platforms like Ahrefs and Semrush also track rankings. Watch the searches tied to your services because movement on a high-intent keyword tells you more than movement on an unrelated one.
In Search Console, separate branded queries containing your name from non-branded ones. Then use GA4 to examine landing pages that generate leads, rather than relying on sitewide totals.
CTR depends heavily on whether Google shows an AI answer. A 2026 report from First Page Sage finds the following:
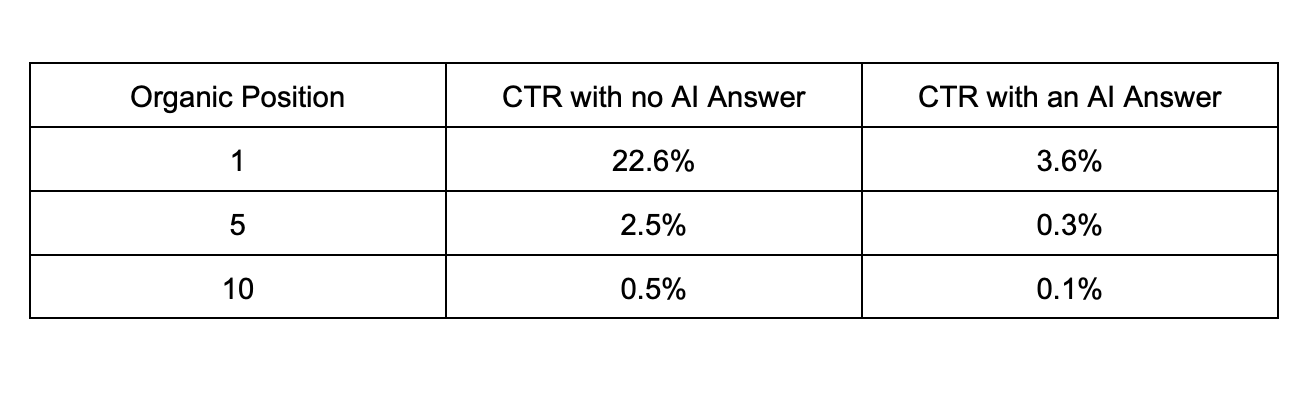
CTR and benchmarks vary, so treat these figures as reference points only. Still, the basic trend is clear: websites tend to receive more clicks when they’re ranked well and appear in AI search results, but appearing in those AI search results may actually reduce CTR because if someone gets the answer they’re looking for (even if it’s from your website), they might not take the time to click into your site.
If you rank well in the SERPs but your CTR lags, review your titles, descriptions, and surrounding results. If impressions climb while clicks stay flat, check which queries are driving them. Appearing in search results doesn’t guarantee a click. Your title and description may not match what searchers want, competing results may draw more attention, or rising impressions may come from less relevant queries.
How Do You Measure Visibility in AI Answers?
Time to measure visibility in AI. Check how often ChatGPT, Gemini, Google AI, and Perplexity surface your business using these measurements:
Brand mentions: how often an answer names your business.
Source citations: how often an answer links to your website.
AI impressions: how often your page appears in Google’s AI Overviews and AI mode.
For mentions and citations, use an AI visibility monitoring tool or run documented manual tests. Ask about your services, industry, and location without including your company name to see whether platforms bring you up on their own. Divide the answers that name you by the total answers tested, then multiply by 100 for your mention rate. Record the URLs each answer cites, too. Here’s the caveat: a platform can name you without linking, or link without naming you, and the two tell you different things.
For AI impressions, Google launched generative AI reports in Search Console in June 2026. They show impressions in AI Overviews and AI mode by page, country, device, and date. They don’t include clicks, and the same impressions also count in your main Performance report, so don’t add them twice. Google says these reports rolled out worldwide by August 31, 2026.
Log the platform, date, and result of every test, and repeat them regularly since AI answers vary. Your findings describe your tested sample, not every answer a customer sees.
How Does Your Share of Voice Compare With Competitors?
Your visibility is important, but you also need to know how it compares with businesses competing for the same customers. Start by choosing a small group of competitors offering similar services to similar audiences in your geographic market. Then measure every business using the same keywords, AI questions, platforms, and reporting periods.
For example, a Nashville ice cream shop could track how often it and competing local shops appear for “ice cream Nashville” on Google and in AI answers to “Where can I find the best ice cream in Nashville?”
Comparing results over time shows whether you’re gaining visibility faster than competitors or whether they’re pulling ahead.
For traditional search, use a rank-tracking tool’s share-of-voice metric to compare estimated visibility across the same keyword set. For AI answers, divide your brand’s mentions by all brand mentions earned by your defined competitive set, then multiply by 100. Twenty of 100 mentions is a 20% share of voice. That’s different from appearing in 20% of tested answers, so document which definitions you’re using and stick to them.
Which AI Sources Drive Traffic and Conversions?
Visibility tells you that audiences are finding you. Referral data tells you whether they visited your website. In GA4’s Traffic acquisition report, change the primary dimension to Session source/medium to see visits from AI platforms. Group them for comparison and keep the individual breakdowns. Clicks from Google‘s AI features generally arrive as organic search, so this view mostly captures the chat platforms.
Then follow those visitors: landing pages, engagement, and actions such as inquiries, bookings, or purchases. Mark those actions as key events, verify the tracking works, and connect inquiries to your CRM so you can see qualified leads and sales. Some AI visits are recorded as direct traffic when referral information is missing, so treat what you see as the measurable portion.
How Do You Bring It All Into One Reporting View?
Organize the dashboard around visibility, competitive position, website visits, and business outcomes. Show each metric’s source, definition, reporting period, and trend. Google documents how to combine Search Console and Analytics data in Looker Studio, and you can add your AI monitoring and competitive findings alongside it.
Use consistent date ranges, annotate major content or site changes, and review monthly. Each review should end with one next action and the metric you expect it to impact.
Sound like a lot? It is.
GoEpps Can Help You Measure & Improve Performances
Make competitive measurement part of your strategy with AEO by GoEpps. We score your brand against your four closest competitors across 43 metrics in 10 categories each month. Our dashboard tracks AI visibility, competitive benchmarks, and trends, supported by prioritized recommendations.
GoEpps connects that analysis with technical SEO, content, and authority development to help you address the gaps affecting discovery.
Find out where your brand stands and what to improve. Book a free AEO consultation.